


OVERVIEW
Parijat is a premier corporation involved in the delivery & deploying SCADA applications and other support or related software applications using non-proprietary products from Microsoft. Parijat has been successfully applying Microsoft Visual Basic (VB) for SCADA and other related applications since 1992. The advantages of VB over the use of proprietary products are described below:
- It is a Microsoft Product.
- It is a de facto standard across all Microsoft products, VBA and many other companies’ products.
- Most popular development environment and the best Rapid Application Development (RAD) tool in general and for GUI, internet/intranet, client/server or database front-end applications.
- Most popular language that was ever created and an established standard for most fortune 500 Corporations. It has been solidly field proven since its introduction in 1991.
- Built in relational database – most popular desktop relational database – Access, VB6 also has built-in native OLE DB providers for Microsoft SQL server and Oracle without using ODBC.
- Built-in reporting tool – Report Designer.
- Very powerful animation capability.
- Provide a single vendor solution to your software needs.
- For PLC/HMI (Human Machine Interface) or SCADA applications, there are no limits on the number of points, number of displays, number of PLC, and channels (Complex applications are already in place supporting over 14,000 points).
- Runs at blazing throughput speed. Real-time TCP/IP applications are in use with updates of less than 10 milliseconds.
- The quantity of points does not bog the system down.
- SCADA/HMI applications are scalable, maintainable and configurable by users who need not be VB programmers.
- ActiveX drivers are readily available for most PLC, control systems and smart industrial devices.
- On-site training and 24-hour tech support are available.
- Remote monitoring of end-user applications for tech support is also available.
- No run-time licensing from Microsoft.
- Set-up wizard lets you create run-time distribution disks for your application.
- Works transparently with Win 95, 98, NT & 2000 plus as visually embedded tool for CE is available.
- Any and all business-related functions are supported. These features let you use VB for SAP R/3 or BAAN-type applications for ERP, MRP, CMMS, MRO, SCM (Supply Chain Management), preventive maintenance (PM), Process Safety Management (PSM), ISO 9001 certifications, etc. using real-time process data.
- Connection to other legacy relational databases built-in using ODBC.
- Add on Component products from 100s of other companies available at low prices, and these integrate very tightly with VB.
- Extremely fast and object-oriented.
- Ideally suited for simple to complex, multi-PC/ PLC applications.
- Very robust, scalable, and multi-faceted.
- Web-enabled and is the ideal choice for creating both server-side and client-side front-end Web applications.
So it is a proven technology that has the power to seamlessly integrate the core operating tools and shall also operate as a platform to easily and painlessly other enterprise-wide operations requiring software applications, internet/intranet, databases, knowledge-based algorithms, ERP, etc.
Complete, accurate data on electricity usage provides a basis for immediate cost-reductions and for longer-term strategic energy management. Every customer needs to have:
- Comprehensive, real-time load-profile data by site, by meter or by process.
- Knowledge of which loads can be shifted or shed.
- Complete and timely information on all available rates, tariffs and contracts.
Good data also provides energy managers with a firm basis for the decisions they make affecting electricity reliability and cost.
In the deregulated energy market, corporations and government agencies need the ability to closely monitor and control their energy consumption. This capability allows them to manage the cost while serving the public interest by conserving consumption during peak usage.
The generic name for an information solution that meets organizational needs for energy use tracking is Energy Aggregation and Information System(EAIS). Such systems typically make use of and coexist with the existing electricity and gas meter infrastructure. Typical users of the system would be:
- Municipalities
- School districts
- Educational Campuses
- Office campuses
- Service and retail operations with multiple locations.
Each system and the underlying metering devices are networked using either Ethernet, modem or wireless with communications implemented using the TCP/IP protocol. Through the network, the current state and historical readings of distributed energy consumption is monitored in real time and recorded historically. An EAIS system includes meter data servers, application middle-ware, databases and central servers allowing the system to acquire, archive, manipulate, export and provide information to assist in managing consumption. Where present emergency/standby generation capacity can be controlled to help manage peak loads.
Within an EAIS, data is typically tracked at multiple time intervals includes the following:
Real-Time Data Measurement (4-second updates for all readings)
Reporting of the last meter reading from all meters in the system to Aggregate Load Data Server (ALDS) for immediate alarming or load management.
Electrical Measurement (15 minutes)
All electrical data readings are archived periodically on regional or Greenwich hourly time boundaries (hh:00, hh:15, hh:30. hh:45).
Electrical Averages (1 hour)
All electrical data readings averaged and archived on regional or Greenwich hourly time boundaries (hh:00).
Gas Measurement (1 hour)
All gas data readings archived each hour on regional or Greenwich hourly time boundaries (hh:00).
Gas and Electrical Averages (1 day) :
All aggregate electrical and gas data readings averaged and archived each day at a specified regional or Greenwich hourly time boundaries (hh:00).
The ALDS software provides for future definition of additional reporting timeframes or modifications of the existing intervals to match potential energy billing criteria determined by gas or electricity suppliers.
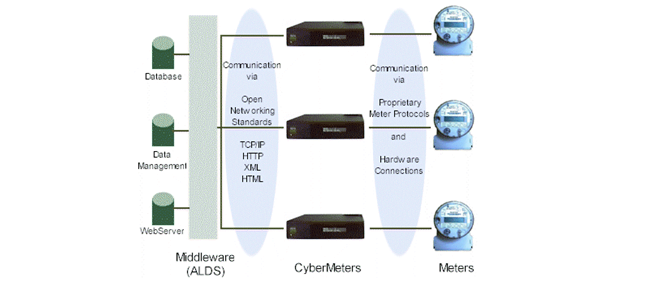
Typical System Architecture Overview
The system is designed to enable easy communication between the middleware and the various meters so that the Aggregate Load Data Server (ALDS) application middle ware can obtain meter readings through the CyberMeter. To do this, a CyberMeter is connected to each meter using a serial, Ethernet, or KYZ hardware connection. The CyberMeter pulls the data from the meter and then translates the data from the proprietary meter protocol. The information the CyberMeter pulls is collected and saved in the CyberMeter so that should the network go down, the data in the CyberMeter will not be lost. Under normal circumstances, the data is transferred to the ALDS at a designated time or frequency using open networking standards, such as TCP/IP, HTTP, XML, and HTML.
OPEN INTERFACE TO METER READINGS
The CyberMeter Data Server (CMDS) provides an open TCP/IP interface to meter data so central servers and enterprise level middleware/software can easily manage and aggregate the data without becoming bogged down in proprietary and digital pulse counting interfaces. CMDSs make use of and coexist with the existing electricity and gas meter infrastructure.
Each CMDS is networked using Ethernet, modem, or wireless connections with TCP/IP as the basis for network communications. Through the network, the current state of distributed energy consumption is monitored in real time and recorded historically. When managed by a central server, the system can acquire, archive, manipulate, and export data and manage consumption or sourcing/generation of energy through control commands sent over the network.
Typical data tracked by the CMDS are:
- Electrical volts
- Electrical amperes
- Power kilowatts
- Power kiloVARs
- Power factor
- Energy kilowatt hours
- Energy kiloVAR hours
- Gas hourly CCF and MMBTUs
- Gas daily CCF and MMBTUs
These measurements provide the most basic information for analyzing and monitoring current energy usage and power efficiency. The system is flexible and expandable to allow for future additions, including measurements such as outside air temperature, humidity, winds, wind chill, etc.
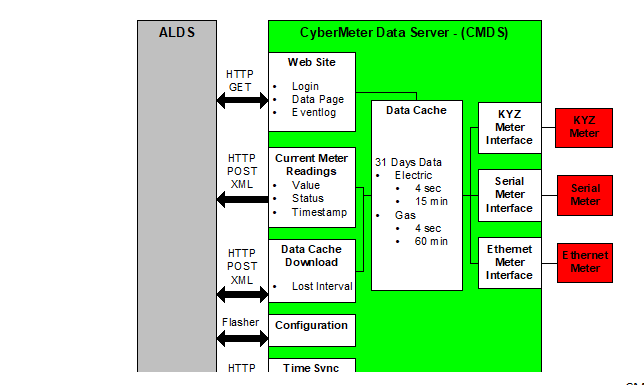
ALDS Interface
The CMDS is designed to communicate with an Aggregate Load Data Server (ALDS). The ALDS provides centralized management, data aggregation, reporting, and potentially load control. The URL of the ALDS is stored in the CMDS and is configurable through XML configuration files. The ALDS will aggregate data and manage a number of CMDSs. The ALDS will communicate with each CMDS to:
- Collect XML formatted current meter readings
- Initiate a bulk data download
- Manage the CMDS configuration through the FLASHER Interface
- Synchronize the CMDS time with the ALDS
The CMDS collects electrical and gas meter readings. The CMDS is flexible and can either send the meter data to the ALDS or wait for a data request from the ALDS. If an interval is missed, the ALDS can request the data at a later time. Meter reading data transfers between the CMDS and the ALDS use XML to describe the data and HTTP to send the data using POST commands. Data transactions are conducted at specific and programmable time intervals. The CMDS is pre-configured to support 4 second reporting intervals for electrical metering and 1-hour reporting intervals for gas metering. The software provides for future definition of additional reporting timeframes or modifications of the existing intervals to match potential energy billing criteria determined by gas or electricity suppliers.
All meter data is cached and stored for a maximum of 31 days. The cached data is sent from the CMDS in response to an ALDS issuing a HTTP POST bulk data dump.
Data is formatted using specific XML tag sets like Web Distributed Data Exchange (WDDX) (more information can be found for WDDX at http:/.www.wddx.org). XML data output format is alterable by modifying dynamic XML templates. No executable application program changes are required to modify the XML output data format.
The CMDS hosts a local web site (Figure 3) that requires a valid username and password to gain access to any of its pages. The web site includes a web page that provides a detailed transaction log and a web page that contains the last data transferred. This last page displays the company, device, input IDs
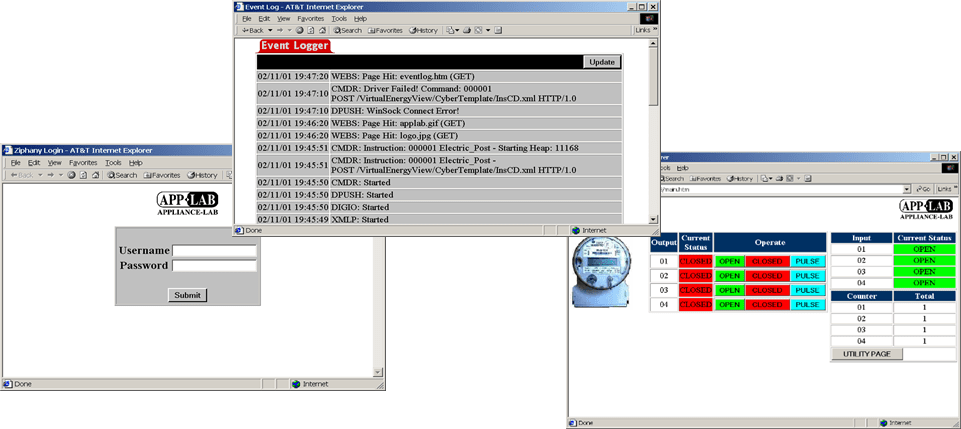
Figure 3: CMDS Web Pages
All programmable parameters and other configuration options are supported through downloadable XML files. These files are stored in non-volatile flash memory and are managed through a proprietary smart bios called FLASHER TM. FLASHER also provides the means to configure network settings, date/time, username, password, and other system options.
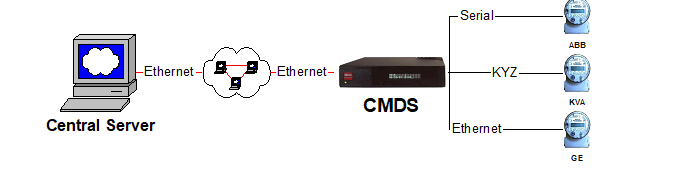
Meter Interface
The system architecture is based on a distributed computing model, with the CMDSs acting as remote communications gateways to provide a low cost, reliable, and flexible interface to the meters. As gateways, they provide the link for meter data to the TCP/IP-based network, and then back to the central server (Figure 4).
The data collection process for the CMDS is configured through the XML-based application framework. XML configuration files configure the CMDS’s:
- Meter interface.
- Intervals to process and store meter readings.
- XML data output format.
- Web page display.
The CyberMeter hardware discussed here can also be a PC or a Windows CE device.