Municipal SCADA System NGSH-0209
This software provides functionality to monitor the water system via a PLC(s), have the ability to manage the process, checking for alarm conditions, ability to view real time data and archived data on the Trending screen, printing various reports. The software was developed and configured using Parijat SCADA development system which is Microsoft Visual Studio based non-proprietary system.
System Architecture
The system includes a stand-alone PC Server with Ethernet communication or secure wireless, which will be connected to the PLC side Ethernet gateway.
Graphic Displays
Water Plants
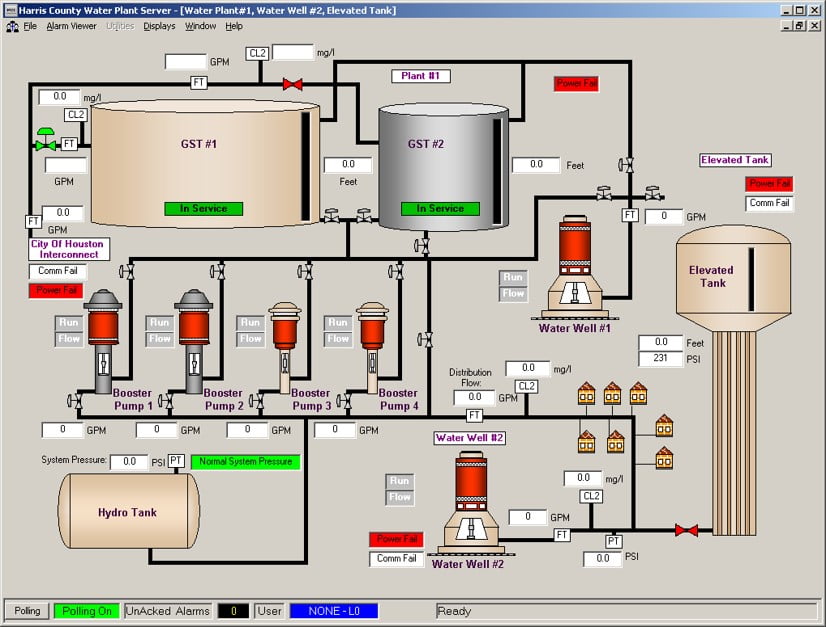
This display provides an overall picture of clean water system which includes Ground Storage Tanks, Booster Pumps, Water Wells, Hydro Pressure Tank, Elevated Tank, Various Valves. Shown labels represent actual values for System Pressure, Flow Rates, Chlorine Values, Levels, and bit statuses for variety of alarm conditions.
Lift Station Plan & Water Plants
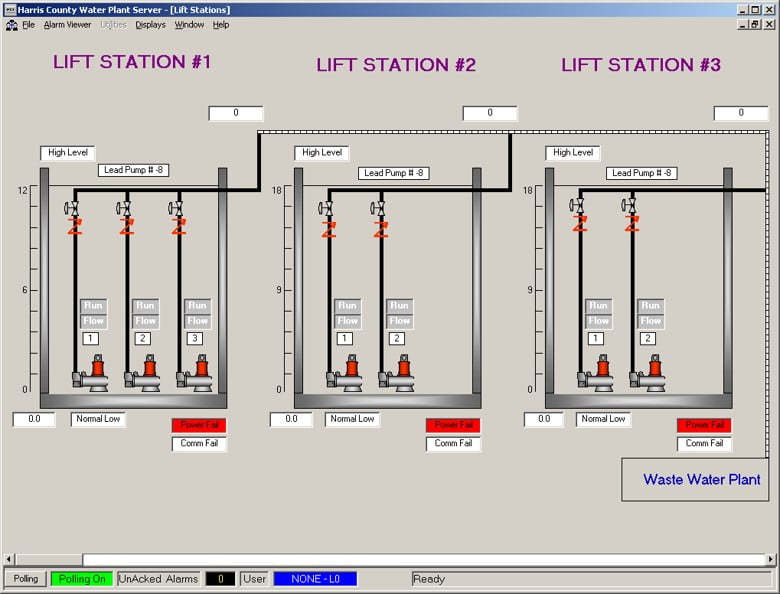
This display provides overall picture of Lift Stations water system which includes Pumps, Check Valves, Ground Storage Tanks, Booster Pumps, Water Wells, Hydro Pressure Tank, Elevated Tank, Various Valves. Shown labels represent actual values for System Pressure, Flow Rates, Chlorine Values, Levels, and bit statuses for variety of alarm conditions.
Lift Station Plan and Water Plant
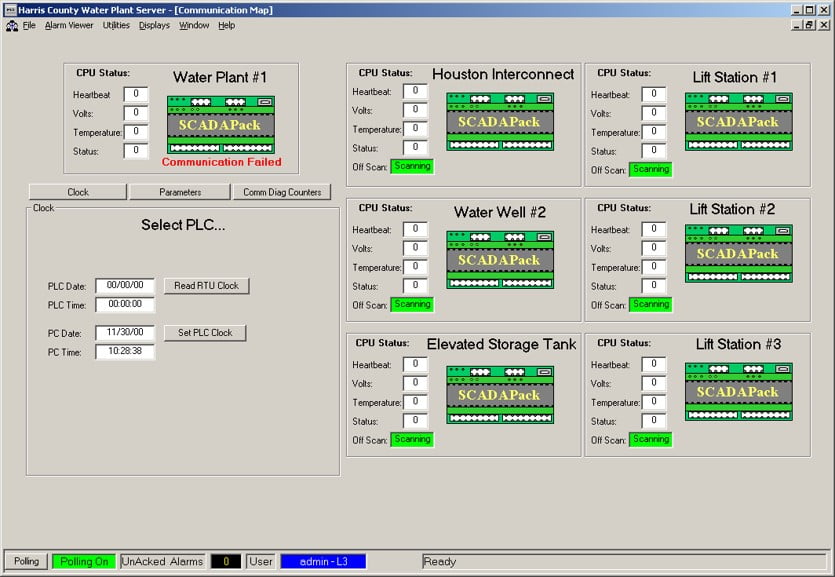
Communication Display provides you with communication information for every PLC. Also, it provides some details for every RTU such as Clock time, Parameters, Comm Diagnostics.
Options:
Any other protocol support simultaneously
Unlimited # of edge devices with multiple networks
Redundant or clustered servers
3D view
GIS support
Water modelling support
Epanet interface
Cityview interface
Wireless adapters – Cell, Satellite, LORA, BLE etc.
Cloud (Private or Public)
Alarm notifications
Water leak detection
Water distribution metering system
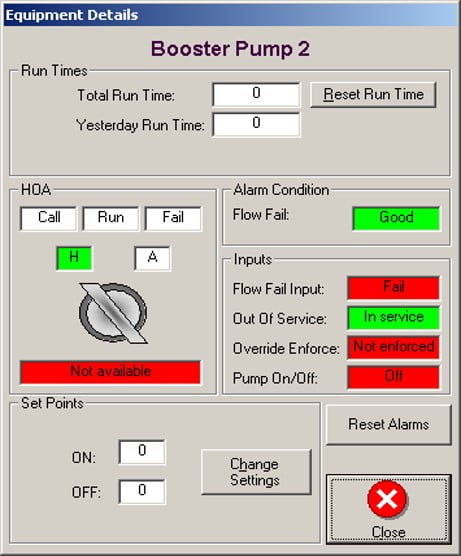
Equipment Details
This screen provides more details on Pumps and valves such as Run times, Set points, Alarm conditions, Run status, and ability to control equipment.
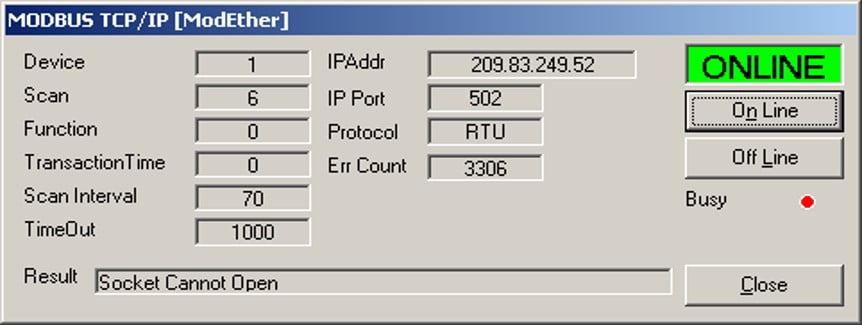
Communication Information Display
This display shows the current comm. settings and status.
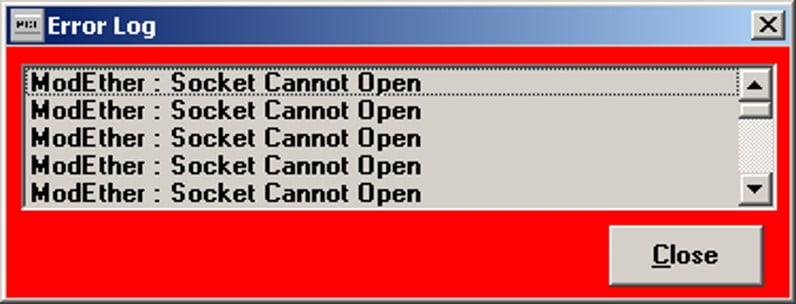
Error Messenger
This window displays errors that occurred during the process. For example: Communication Error.
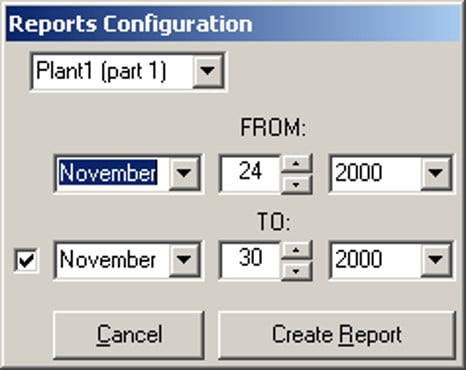
Report Configuration
This screen provides you with select data you want to put on the report. You can select different locations and different periods of time to retrieve data.
Reports
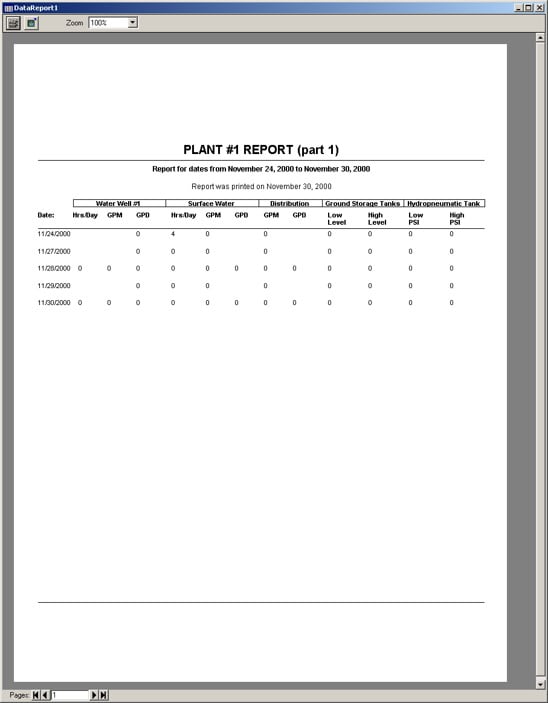
Report displaying data selected from report configuration screen. Any type of reports can be developed – simple to complex. These reports can be printed or saved as .html or .PDF file.
Alarm Viewer
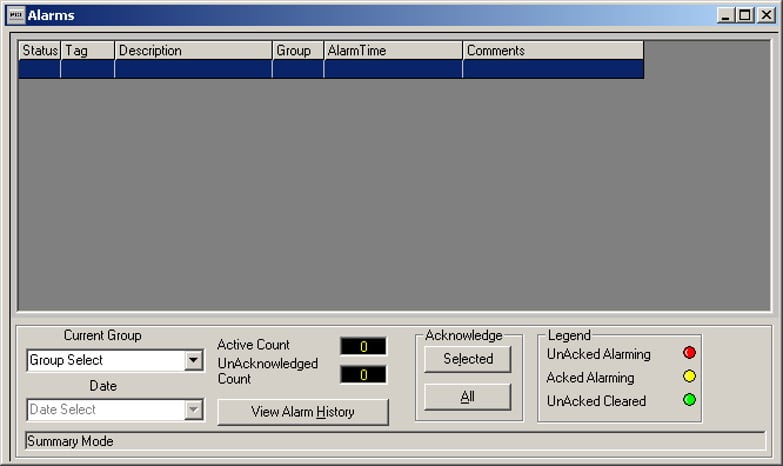
This screen will show all alarm conditions that are active or happened before. You can acknowledge alarms.
Trending
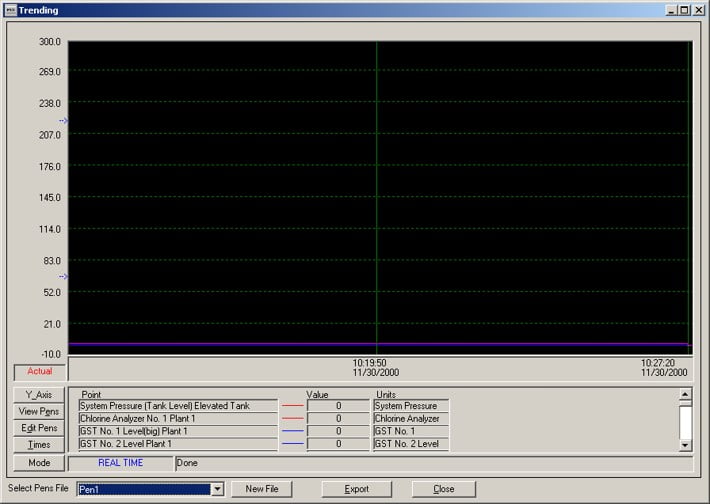
Trending screen will show real time or historic data for selected points. You can specify specific points from the list to monitor, and assign different colors to the points. You can resize scaling.
